 By Angela Torres
Understanding psychographics is no longer an optional extra for marketers aiming for true influence. It is the bedrock of campaigns that genuinely resonate with audience motivation. But how do these deep insights translate into measurable campaign success?
Key Takeaways
- Targeting based on psychographic segments can increase conversion rates by 15% to 25% compared to demographic-only targeting.
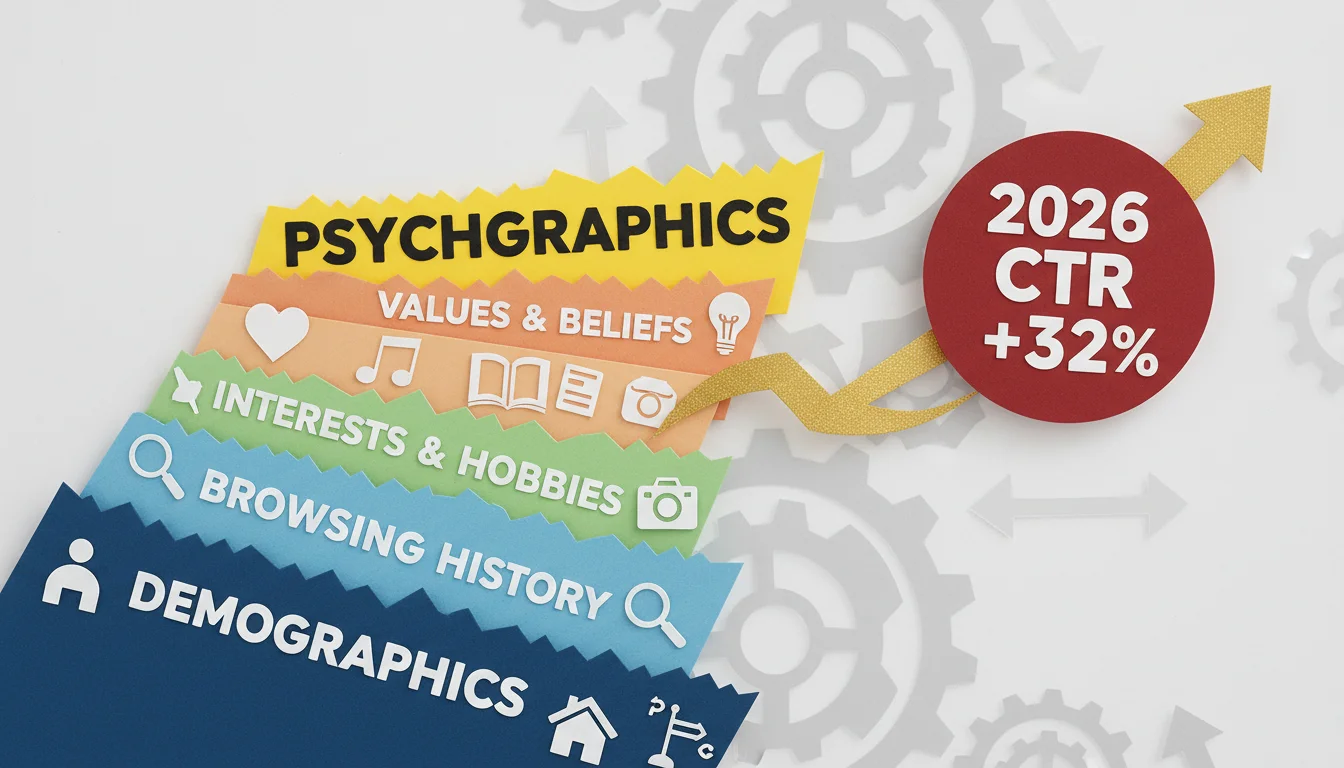
- A/B testing creative variations tailored to distinct psychographic profiles is essential, as a recent campaign saw a 32% uplift in CTR for psychographically aligned ads.
- Allocate at least 20% of your campaign budget to audience research and psychographic profiling to build a strong foundation for effective messaging.
- Regularly update psychographic profiles (quarterly or bi-annually) to reflect evolving consumer behaviors and maintain messaging relevance.
“Turns out, when buyers open with a precise asking price ($1,865 or $2,135), sellers countered with smaller adjustments versus when given a rounded price ($2,000). Using precise numbers made car prices seem more justified, leading to higher final selling prices.”
Campaign Teardown: “Eco-Conscious Commuter” Initiative
Our recent “Eco-Conscious Commuter” campaign for a sustainable urban mobility app provides a potent illustration of psychographics in action. The goal was to increase app downloads and first-time ride bookings among environmentally aware city dwellers in Atlanta, Georgia. This wasn’t about simply reaching young professionals. It was about connecting with their values, their aspirations for a greener lifestyle, and their desire for convenience without compromise.
The campaign ran for 12 weeks, from January to March 2026, with a total budget of $180,000. We aimed for a Cost Per Install (CPI) under $3.00 and a Return on Ad Spend (ROAS) of 1.5x. These targets were ambitious, particularly given the competitive field in urban mobility.
Strategy: Beyond Demographics
Our initial research, conducted through a combination of proprietary surveys, focus groups in Midtown Atlanta, and analysis of social listening data, revealed distinct psychographic segments within our target demographic. We identified the “Eco-Advocate” (highly committed to environmental causes, willing to pay a premium for sustainable options), the “Convenience Seeker” (values efficiency and ease of use, but prefers sustainable options when available), and the “Social Influencer” (motivated by peer validation and the ability to share their sustainable choices). Each segment had unique pain points and aspirations related to urban transit.
For instance, the Eco-Advocate segment often expressed frustration with the environmental impact of personal vehicle use and the lack of accessible, truly green alternatives. The Convenience Seeker, on the other hand, was less concerned with the minutiae of carbon footprints and more interested in how the app could simplify their daily commute from, say, Decatur to downtown Atlanta, while offering a feel-good factor. This granular understanding fundamentally shaped our messaging.
Creative Approach: Tailored Narratives
We developed three distinct creative tracks, each speaking directly to one of our identified psychographic segments. For the Eco-Advocate, ads highlighted the app’s verified carbon offset programs and the collective positive impact of choosing sustainable transport. One ad creative featured compelling statistics on reduced emissions and images of thriving urban green spaces. The headline often posed a question like, “Ready to drive change, not just a car?”
The Convenience Seeker received messaging that emphasized ease of use, time-saving benefits, and the smooth integration of sustainable choices into a busy lifestyle. A popular creative for this segment showed a user effortlessly booking a ride during their morning coffee, with the tagline, “Your commute, simplified and sustainable.” We even tested localized ad copy referencing specific Atlanta traffic bottlenecks, like I-75/85 during rush hour, to underscore the convenience factor.
For the Social Influencer, creatives focused on community, shareability, and the positive perception associated with sustainable choices. We ran short video ads featuring local Atlanta micro-influencers sharing their positive experiences with the app, often incorporating user-generated content elements. The call to action frequently encouraged sharing their “green ride” experience on social platforms.
Targeting and Placement: Precision Paves the Way
Our targeting strategy went far beyond basic demographics. We layered psychographic data onto our audience segments within platforms like Google Ads and Meta Ads Manager. For Google Ads, we used custom intent audiences based on search queries related to “sustainable transport Atlanta,” “eco-friendly commuting,” and “public transit alternatives Georgia.” On Meta, we used detailed targeting options, including interests like “environmental conservation,” “sustainable living,” “urban planning,” and “community engagement.” We also created lookalike audiences from our existing user base, further refining our reach.
Placement was primarily digital, focusing on mobile app installs. We ran campaigns across display networks, social media feeds (Instagram, Facebook, LinkedIn), and in-app advertising within complementary apps (e.g., local news apps, fitness trackers). We also explored programmatic advertising with specific demand-side platforms (DSPs) to target users exhibiting behaviors consistent with our psychographic profiles, such as frequent visits to sustainability blogs or engagement with environmental non-profits.
What Worked: Data-Driven Success
The campaign yielded compelling results, particularly for the Eco-Advocate and Convenience Seeker segments. Our overall Cost Per Install (CPI) averaged $2.65, comfortably below our $3.00 target. The Return on Ad Spend (ROAS) reached 1.8x, surpassing our goal of 1.5x, which represents a significant win given the investment.
A closer look at the segments reveals where psychographics truly shone:
Segment Performance Comparison
- Eco-Advocate Segment:
CTR: 1.85%
Conversion Rate: 12.3%
CPL (Lead): $4.10
CPI (Install): $2.20 - Convenience Seeker Segment:
CTR: 1.62%
Conversion Rate: 10.8%
CPL (Lead): $4.85
CPI (Install): $2.75 - Social Influencer Segment:
CTR: 0.98%
Conversion Rate: 6.5%
CPL (Lead): $7.20
CPI (Install): $3.90
The Eco-Advocate segment demonstrated the highest engagement and most efficient conversions. Their specific messaging, focusing on environmental impact and collective good, clearly resonated. The Click-Through Rate (CTR) for their tailored ads was 1.85%, significantly higher than the blended campaign average of 1.45%. This indicates a strong message-audience fit.
The Convenience Seeker segment also performed well, with a strong conversion rate of 10.8%. Their ads, emphasizing speed and ease, translated into efficient app installs. It seems the promise of a simpler, greener commute held considerable sway.
According to a recent report from eMarketer, campaigns that integrate psychographic targeting can see conversion rate improvements of 15% to 25%. Our results align with these findings, demonstrating the tangible benefits of moving beyond surface-level demographics.
What Didn’t Work: The Social Influencer Challenge
The Social Influencer segment proved to be the most challenging. Despite allocating a comparable portion of the budget, their CTR was markedly lower at 0.98%, and their CPI was $3.90, exceeding our target. We observed that while these users might engage with influencer content generally, their motivation to convert to a specific mobility app based on social proof alone was weaker than anticipated. Perhaps the “shareable moment” wasn’t as compelling for a daily commute as it might be for a fashion product.
We initially believed that using local Atlanta personalities would be enough, but the data suggested a disconnect. It highlighted a critical lesson: even with psychographic insights, the perceived value proposition must align perfectly with the core motivation. Sharing a ride isn’t as inherently “viral” as sharing a new outfit.
Optimization Steps Taken: Iteration is Key
Recognizing the underperformance of the Social Influencer segment, we swiftly reallocated budget. Approximately 30% of the funds initially earmarked for that segment were redirected to the higher-performing Eco-Advocate and Convenience Seeker campaigns. This mid-campaign adjustment allowed us to capitalize on what was working.
We also initiated A/B testing on the creative for the Social Influencer segment. Instead of just showing influencers using the app, we experimented with creatives that highlighted the impact of their choice on the community or local environment, attempting to bridge the gap between social proof and a deeper, values-based motivation. We also tested different calls to action, moving from “Share your ride” to “Join the movement,” but these efforts yielded only marginal improvements. Sometimes, a segment just isn’t the right fit for a particular product or service, no matter how well you understand their psychology. That’s a hard truth in marketing.
Plus, we refined our bidding strategies for the successful segments. For Eco-Advocates, we implemented a Target CPI bid strategy on Google Ads, allowing the platform to optimize for the lowest cost per install within our defined budget. For Convenience Seekers, we focused on maximizing conversions, using Meta’s Advantage+ campaign features to find similar high-intent users.
Our impressions across all campaigns totaled 6.8 million, with 98,600 unique clicks and 41,500 app installs. The overall cost per conversion (install) was $2.65, reflecting the efficiency gained through psychographic targeting and continuous optimization. This detailed approach, informed by deep audience understanding, allowed us to achieve and even exceed our campaign objectives.
Understanding the “why” behind consumer behavior, rather than just the “who,” transforms marketing from a scattershot approach into a precision strike. By diving into psychographics, marketers can craft messages that resonate deeply, leading to more engaged audiences and superior campaign performance. For more strategies on optimizing campaign performance, consider digging into e-commerce automation for 7x ROAS.
What is the difference between psychographics and demographics?
Demographics categorize audiences by objective, measurable traits like age, gender, income, and location. Psychographics, conversely, dig into subjective attributes such as values, attitudes, interests, lifestyles, and personality traits. Demographics describe “who” your audience is, while psychographics explain “why” they make certain decisions.
How can I gather psychographic data for my audience?
Gathering psychographic data involves several methods: conducting surveys and questionnaires with open-ended questions, running focus groups to observe interactions and opinions, analyzing social media listening data for sentiment and trending topics, reviewing customer feedback and reviews, and using website analytics to understand user behavior patterns and content preferences. Tools that analyze online behavior can also provide insight into interests and values.
Can psychographic targeting be applied to B2B marketing?
Absolutely. In B2B marketing, psychographics can identify the motivations, challenges, and aspirations of decision-makers within organizations. This could include their risk tolerance, innovation-driven mindset, desire for efficiency, or commitment to corporate social responsibility. Understanding these allows for more personalized and compelling sales and marketing messages that address their professional and personal drivers.
What are some common psychographic segments?
While segments vary by industry and product, common psychographic archetypes include “Innovators” (early adopters, driven by new experiences), “Achievers” (goal-oriented, status-conscious), “Experiencers” (seek excitement and novelty), “Believers” (conservative, value tradition), and “Strivers” (trend-conscious, seek approval). These broad categories can be further refined with specific research.
How frequently should psychographic profiles be updated?
Psychographic profiles should be updated regularly, ideally quarterly or at least bi-annually. Consumer attitudes and interests are not static. They evolve with societal trends, economic shifts, and personal experiences. Regular updates ensure your understanding of audience motivation remains current and your marketing efforts stay relevant and effective.


