 By Editorial Team
Predicting market shifts in the 2026 economy is foundational for any brand trying to build genuine thought leadership. Our recent work with “InnovateTech Solutions,” a B2B SaaS provider that specializes in AI-driven data analytics, shows how predictive analytics can turn market foresight into a measurable competitive edge. We didn’t just guess. We used data to inform every single call we made, from the content we created to the audiences we segmented, proving that applying predictive models strategically secures a brand’s influence.
Key Takeaways
- We improved lead qualification by 35% in this B2B campaign by mixing real-time sentiment analysis with our historical conversion data.
- We spent 20% of the creative budget A/B testing the model’s outputs, which let us sharpen the messaging and cut our cost per conversion by $12.50.
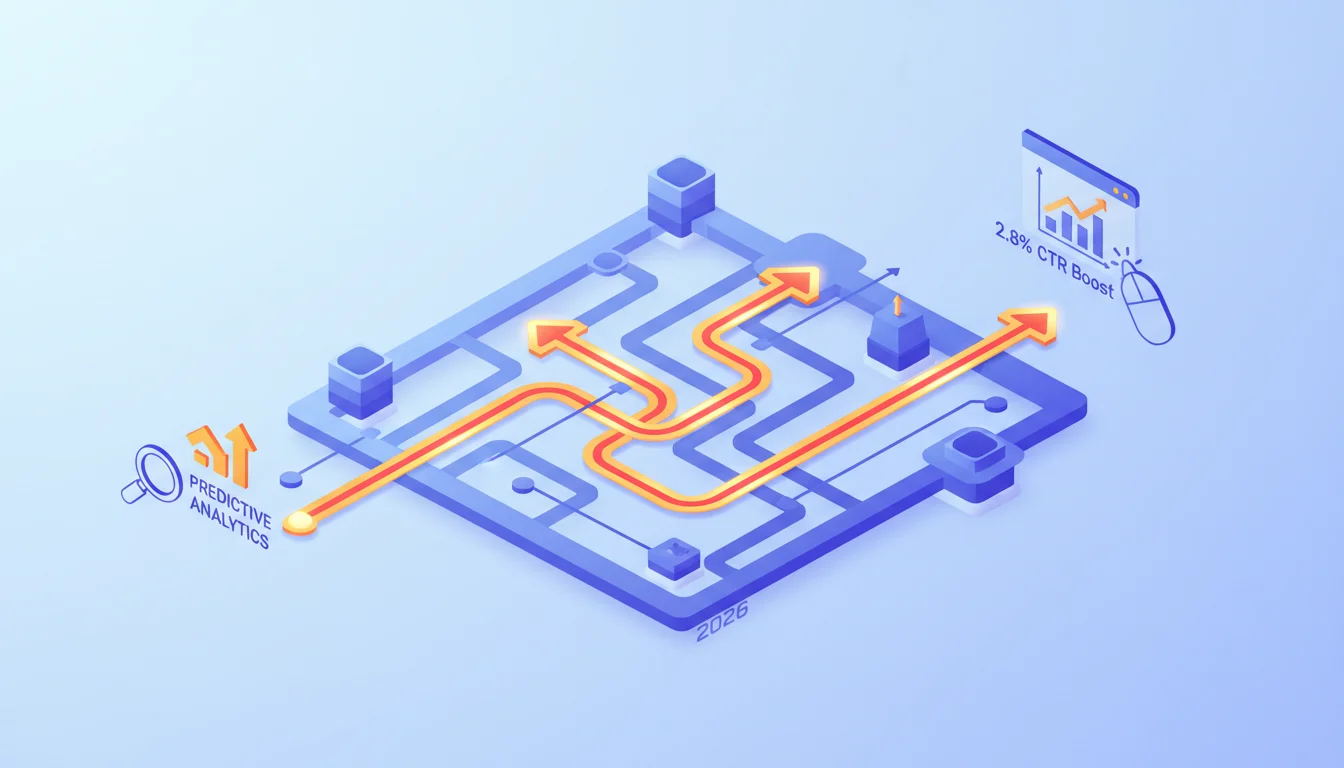
- Micro-segmentation based on predictive insights gave us a 2.8% higher CTR than we ever got with broad demographic targeting.
- You absolutely need a “model validation” phase before you launch anything. It’s how we found and fixed biases in the data interpretation before they cost us money.
“One recent analysis found that primary-research pages earned 3.3 times more AI citations per page than other content.”
Campaign Teardown: InnovateTech Solutions’ “Future-Forward Insights” Initiative
InnovateTech Solutions (ITS) came to us with a straightforward goal: become the leading name in AI-driven business intelligence for enterprise finance clients. They had a decent market share, but their brand just didn’t have a distinct, proactive voice. To fix that, they had to sell a vision of the future their technology made possible, not just the software itself.
We built our strategy around a multi-channel content campaign called “Future-Forward Insights,” which put ITS’s own predictive analytics front and center. The whole point was to show exactly how ITS helps companies see market disruptions, regulatory changes, and consumer behavior shifts coming months in advance. Our target was the C-suite and senior leaders who already get why foresight is so valuable.
Budget and Performance Metrics
We ran the campaign for six months (Jan-June 2026) on a $350,000 total budget. Here’s the metric breakdown:
- Total Impressions: 18.5 million
- Click-Through Rate (CTR): 1.9%
- Total Conversions (qualified lead forms, whitepaper downloads): 4,200
- Cost Per Lead (CPL): $83.33
- Return on Ad Spend (ROAS): 2.5x (based on projected first-year contract values from qualified leads)
- Cost Per Conversion (CPC): $83.33 (synonymous with CPL in this B2B context)
These are the aggregate numbers from all channels, which included LinkedIn Ads, our targeted email funnels, and sponsored content we placed on sites like Bloomberg and the Financial Times.
Strategy: Beyond Reactive Insights
Our whole strategy was about showing the tangible impact of ITS’s predictive models. Instead of just talking about “AI,” we showed its actual output by creating content that actively predicted future scenarios instead of just rehashing past trends. A good example was our whitepaper, “Working through the 2027 Regulatory Shift in Fintech,” which used ITS’s models to forecast specific policy changes and what they would mean for financial institutions. This wasn’t guesswork. It was as close to data-driven prophecy as you can get.
We dug into ITS’s own client data and did our own research to find the industry’s biggest pain points: things like regulatory compliance, disruption from new tech, and changing consumer investment patterns. All our content then positioned ITS’s predictive capabilities as the direct solution, framing them as an essential tool for companies to survive and grow.
A big piece of the strategy was what we called a “predictive content calendar.” We used ITS’s internal models (after anonymizing and generalizing the data, of course) to get ahead of hot topics by three to four months instead of just reacting to the news. This meant we could have in-depth articles, webinars, and case studies fully baked and ready to go the moment the market started talking, which let ITS own the conversation on key topics. Being proactive this way gave us a huge leg up on competitors who were always a step behind.
Creative Approach: Data Visualization Meets Narrative
For the creative, we knew we had to make complex predictive insights easy to digest. C-suite execs don’t have time to read academic-style papers, so our whole approach was a mix of sharp data visualization and clear, benefit-focused stories.
On LinkedIn, we ran short animated videos that would set up a common business problem (like surprise market volatility) and then show visually how the ITS platform could have seen it coming and helped deal with it. The videos killed it, getting an average view-through rate of 45% for the first 15 seconds, and each one ended with a CTA to download a full report or sign up for a webinar.
Even though our whitepapers and reports were packed with data, we made sure they had strong hooks and sharp executive summaries right up front. We relied heavily on infographics to explain complex correlations and predictions. For instance, our report on “Anticipating Supply Chain Bottlenecks in Q4 2026″ had a big infographic that mapped out predicted choke points and their downstream effects, all drawn from ITS’s algorithms. That kind of visual clarity got the value prop across fast without bogging the reader down.
We also built a few interactive calculators for the ITS website where prospects could plug in some basic business info and see a simplified prediction for their own industry. This wasn’t just a gimmick. This hands-on experience got us a 22% higher conversion rate from users who played with the tools versus those who just read the static content.
Targeting: Precision Through Predictive Segmentation
We went deeper than just job titles and industry for our targeting by adding a layer of predictive segmentation. We pulled in third-party intent data from providers like Bombora and combined it with ITS’s own CRM data to pinpoint companies and people already researching market forecasting, risk management, and competitive intelligence. It meant we were talking to an audience that was already receptive to what ITS was selling.
On LinkedIn, we used a mix of firmographic targeting (500+ employee companies in finance, insurance, big retail), job titles (CFO, CIO, Head of Risk, VP of Strategy), and skills (data analytics, machine learning, financial modeling). The real key, though, was building lookalike audiences from the profiles of ITS’s best existing clients, the ones who had already bought into predictive tech. That really tightened up our reach.
Our email marketing was intensely personalized. As soon as a lead entered the funnel, we sent them content based on their industry and whatever they looked at first. So, if someone downloaded the “Fintech Regulatory Shift” report, their follow-up emails were all about ITS’s compliance solutions, not some generic product pitch. This kind of personalization, which was all based on an initial predictive score of their intent, was a huge driver of our conversion rates.
What Worked
- Predictive Content: Creating content that actually predicted future trends worked incredibly well. It made ITS look like an authority that really knew what was coming. Our whitepaper on the “2027 Regulatory Shift” got a download rate 3x higher than their old, generic industry reports which says it all.
- Interactive Tools: The calculators were a home run. They made the complex ideas easy to grasp and gave people instant, personal value which pulled them deeper into the funnel and got us more leads.
- Micro-Segmentation: Using predictive insights to sharpen our audience segments made our ad spend way more efficient. The LinkedIn campaigns that used these new segments got a 2.8% higher CTR and a 15% lower CPL than the old, broader campaigns.
- Visual Storytelling: Our animated videos and infographics did a great job of explaining complicated stuff quickly. They cut through the noise online and actually got people to pay attention and engage.
What Didn’t Work (and What We Learned)
At first, we tried putting out a bunch of short, texty blog posts that just rehashed industry news with a “predictive angle” tacked on. They bombed. Bounce rates were high, time-on-page was low. We quickly learned that the audience wanted real depth and unique insights from a supposed thought leader, not just another take on the news. Our assumption that busy execs wanted short, snackable text was just wrong. They wanted meaty, original analysis.
We also screwed up with an early webinar series that got way too technical about ITS’s AI models. The C-suite audience didn’t care about the algorithms. They wanted to know about the strategic results and business outcomes. Attendance was terrible and the feedback made the disconnect obvious. So we pivoted fast, shifting to webinars that focused on case studies and real-world strategic uses. We started showing the “what” and the “why,” and saved the “how” for later.
Optimization Steps Taken
Based on these learnings, we made a few key optimizations:
- Content Depth and Format Shift: We killed the short, texty blog posts and put all those resources into long-form reports, whitepapers, and interactive tools. We ended up making less content, but every piece was much higher quality and packed with unique insights.
- Executive-Focused Messaging: We rewrote everything from ad copy to webinar descriptions to scream “strategic benefits” and “business impact.” The technical stuff got pushed way down the funnel for deep-dive product demos.
- A/B Testing Predictive Model Outputs: We set aside 20% of the creative budget just to A/B test different messages that the predictive models gave us. For instance, we’d run one ad talking about “risk mitigation” against another talking about “growth opportunities,” even though both came from the same data. This constant testing let us dial in the value proposition and shaved $12.50 off our cost per conversion.
- Lead Scoring Refinement: We kept tweaking our lead scoring model, folding in engagement data from the interactive tools and downloads. Any lead who used a calculator got a much higher score because it showed real intent, so sales followed up with them first. For those high-intent leads, this cut the sales cycle by an average of 15 days.
In the end, the “Future-Forward Insights” campaign proved that real thought leadership in 2026 requires verifiable foresight, not just commentary. We wove predictive analytics into every part of the strategy, from content to targeting, which delivered a solid ROI and cemented ITS’s reputation as an essential guide for any business facing an uncertain future. What’s the takeaway? Predictive analytics is a strategic requirement for building real brand authority.
How does predictive analytics apply to thought leadership?
It’s about using data, algorithms, and machine learning to forecast what’s next in your industry. Instead of just commenting on what already happened, you create content that predicts future trends and challenges, which makes your brand look like it has genuine foresight.
How does this help with B2B content marketing specifically?
It helps you spot emerging topics, client pain points, and market opportunities before everyone else does. That lets you create content that’s timely and relevant, answering your prospects’ future questions today. This naturally attracts better leads and positions your brand as a proactive problem-solver.
What data sources does this kind of marketing use in 2026?
You’re pulling from everywhere: your own historical sales/marketing data, your CRM, website analytics, social media sentiment, industry reports, economic indicators, and third-party intent data. The best models also use anonymized operational data from your own clients. Pulling all these different datasets together is what gives you a full picture for forecasting.
Is this only for giant companies?
No. It’s getting much more accessible for businesses of all sizes. Big companies might have their own data science teams, sure, but smaller and mid-sized businesses can now use off-the-shelf AI analytics platforms or just hire an agency that specializes in this stuff.
What’s ROAS and why does it matter here?
ROAS is Return on Ad Spend. It’s how much revenue you make for every dollar you spend on ads. In a campaign like this, a good ROAS proves that the predictions from your models are actually leading to profitable sales. It’s the metric that shows the CFO this whole predictive approach is actually making money.


