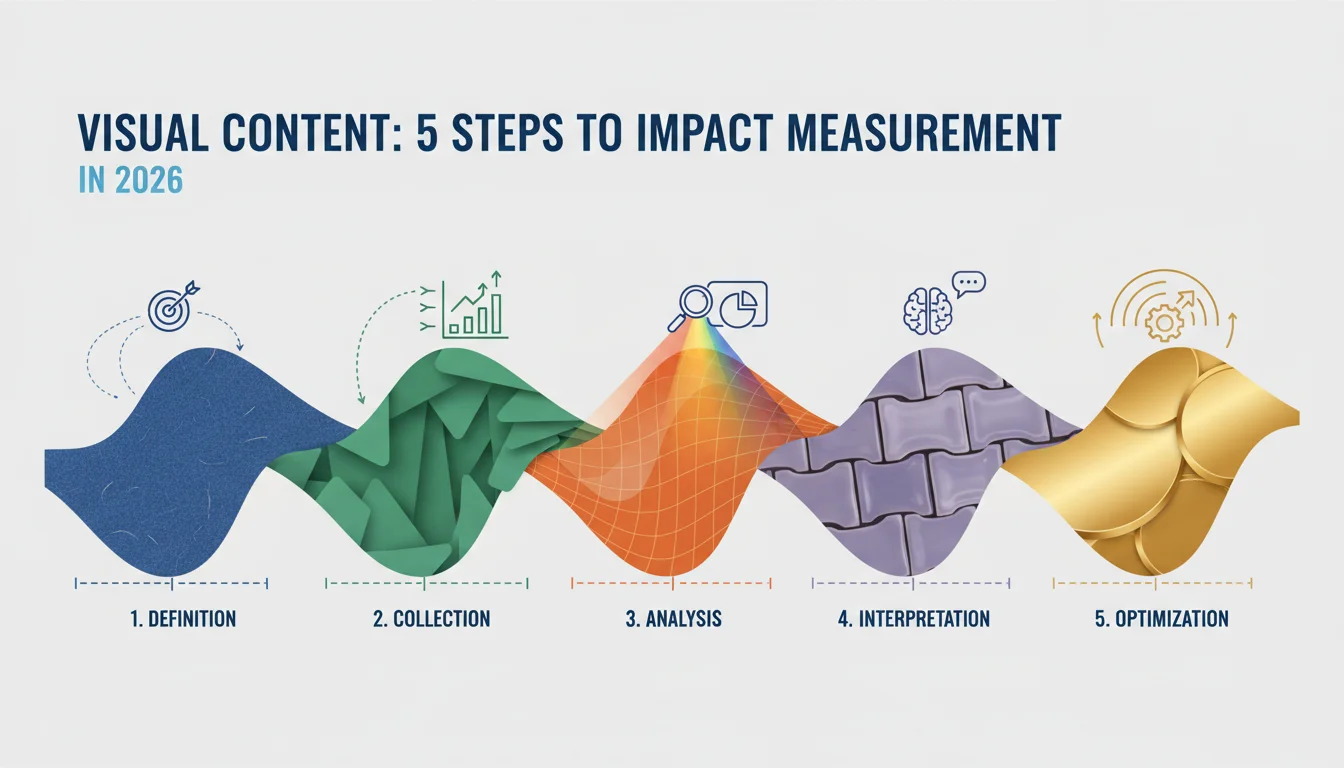
 By Editorial Team
Measuring the true impact of visual content is no longer optional. It’s fundamental for demonstrating ROI and refining future strategies. Many marketers still struggle to move beyond vanity metrics, missing the deeper insights that drive genuine business growth. How can we shift from simply tracking views to understanding the tangible value of our visual narratives?
Key Takeaways
- Implement a multi-touch attribution model to accurately credit visual content across the customer journey, moving beyond last-click metrics.
- Use A/B testing for creative elements, such as thumbnail images and video intros, to identify specific visual components that drive higher engagement and conversion rates.
- Integrate CRM data with content analytics platforms to connect visual content consumption directly to sales pipeline progression and customer lifetime value.
- Establish clear, measurable KPIs for each visual asset, including not just reach and engagement, but also downstream actions like demo requests or product sign-ups.
Campaign Teardown: “Urban Explorer” Product Launch (Q3 2025)
Our “Urban Explorer” campaign, launched in Q3 2025, aimed to introduce a new line of rugged yet stylish messenger bags designed for city commuters. The primary goal was to drive product awareness, generate qualified leads, and in the end increase direct-to-consumer sales. This campaign provides a strong example of how careful impact measurement for visual content can uncover both successes and areas for significant improvement.
Strategy and Creative Approach
The core strategy revolved around showing the product’s durability and aesthetic appeal through aspirational visual storytelling. We developed a suite of high-quality visual assets, including a 60-second hero video, a series of short-form video ads (15-30 seconds), static lifestyle images, and interactive 360-degree product views. The creative emphasized authentic urban settings, featuring diverse models using the bags in everyday scenarios across Atlanta’s BeltLine and the bustling streets of Midtown.
Our targeting focused on young professionals (25-45) residing in major metropolitan areas, with interests in sustainable fashion, outdoor activities, and technology. We deployed these assets across Meta platforms (Facebook, Instagram), LinkedIn, and programmatic display networks. A significant portion of the budget was allocated to video content, recognizing its power to convey product features and emotional connection.
Budget and Duration
The total campaign budget was $180,000, allocated over an eight-week period (August 1 to September 30, 2025). This budget was split approximately 60% towards media spend and 40% towards content creation, including videography, photography, and post-production.
Initial Performance Metrics and Analysis
Upon launch, initial performance looked promising in terms of top-of-funnel metrics. We saw strong impression numbers and respectable click-through rates (CTR) on our video ads, particularly on Instagram Stories. However, deeper analysis revealed a disconnect between engagement and conversion, which prompted a strategic pivot mid-campaign.
Initial Campaign Performance (Weeks 1-4)
| Metric | Value | Notes |
|---|---|---|
| Impressions | 12,500,000 | Across all platforms |
| Reach | 4,800,000 | Unique users exposed to content |
| Average Video View Rate (VVR) | 35% | For 15-second video ads |
| Click-Through Rate (CTR) | 1.8% | Average across all ad types |
| Cost Per Click (CPC) | $1.15 | |
| Cost Per Lead (CPL) | $45.00 | Leads defined as email sign-ups for product updates |
| Return On Ad Spend (ROAS) | 0.8:1 | For direct purchases attributed to ads |
The ROAS of 0.8:1 was a clear indicator that while our visual content generated interest, it wasn’t effectively translating into sales. Our CPL of $45 for an email signup, while not catastrophic, was higher than our target of $30. This pointed to an issue further down the funnel, or perhaps a mismatch between the initial visual promise and the landing page experience. We used Google Analytics 4 to track user journeys from ad click to conversion, noting a significant drop-off between viewing product pages and adding items to the cart.
What Worked
- Short-Form Video Engagement: The 15-second video ads on Instagram Stories achieved an average VVR of 42% and a CTR of 2.5%, significantly outperforming longer formats and static images on that platform. The dynamic, fast-paced nature resonated with the mobile-first audience. According to a 2025 IAB Video Advertising Study, short-form mobile video continues its dominance in driving initial engagement.
- Aspirational Lifestyle Imagery: Our static images featuring models in authentic urban environments had a strong impact on brand perception metrics in post-campaign surveys, improving brand favorability by 15% among exposed groups. They effectively communicated the brand’s desired aesthetic and target demographic.
- Retargeting Effectiveness: Visual content used in retargeting campaigns (display ads showing specific product features to users who had visited product pages) saw a 3x higher CTR compared to prospecting campaigns. This indicates that once initial interest was established, more detailed visual information was effective.
What Didn’t Work (and Why)
- Long-Form Video Conversion: The 60-second hero video, despite high production quality, had an average VVR of only 28% and a low conversion rate. We hypothesized that it was too long for initial awareness stages on platforms like Facebook where users scroll quickly. Its placement was likely incorrect. It might have performed better on product pages or in email sequences for already interested leads. We failed to segment our audience effectively for long-form content.
- Generic Call-to-Actions (CTAs): Our initial CTAs like “Learn More” or “Shop Now” were too broad. With a CPL of $45, it was clear that the visual content wasn’t creating enough urgency or specific desire for the product. Users were clicking but not committing. This is a common pitfall, where the visual captures attention but the follow-through is weak.
- Landing Page Disconnect: While our visual ads were strong, the landing pages they directed to lacked immediate visual reinforcement of the specific product features highlighted in the ads. This often led to confusion and bounce rates exceeding 60% for ad-driven traffic, according to our Google Ads data.
Optimization Steps Taken and Revised Performance
Based on the initial four weeks of data, we implemented several key optimizations:
- A/B Testing Visual Thumbnails and Intros: We began A/B testing different thumbnail images and the first three seconds of our short-form videos. This revealed that thumbnails featuring the bag in action (e.g., being pulled from under a bike seat) performed 20% better in CTR than static product shots. For video intros, a quick, dynamic shot of the bag’s unique magnetic closure increased VVR by 10%.
- Refined CTAs and Landing Page Synchronization: We revised CTAs to be more specific, such as “Discover the Features” or “Pre-Order Now for 10% Off.” Importantly, we created dedicated landing pages that mirrored the specific visual narrative of the ad creative. If an ad highlighted the waterproof feature, the landing page immediately showcased a video demonstrating it. This integration was critical.
- Audience Segmentation for Long-Form Content: The 60-second hero video was repurposed. Instead of being used for prospecting, it became part of an email nurture sequence for leads who had already signed up or visited product pages. We also tested it as an in-stream ad on YouTube, targeting audiences interested in urban commuting gear, where longer content is more accepted.
- Interactive Element Integration: We introduced interactive polls and quizzes within our Instagram Stories, directly related to the visual content (e.g., “Which color would you choose?”). This simple addition improved engagement rates by 18% and provided valuable preference data.
Revised Campaign Performance (Weeks 5-8)
| Metric | Value | Change From Weeks 1-4 | Notes |
|---|---|---|---|
| Impressions | 14,200,000 | +13.6% | Increased budget allocation to best-performing ad sets |
| Reach | 5,500,000 | +14.6% | |
| Average Video View Rate (VVR) | 41% | +6 percentage points | Improved due to A/B testing and audience refinement |
| Click-Through Rate (CTR) | 2.7% | +0.9 percentage points | Stronger visuals and specific CTAs |
| Cost Per Click (CPC) | $0.90 | -$0.25 | More efficient ad spend |
| Cost Per Lead (CPL) | $28.00 | -$17.00 | Improved landing page experience and CTAs |
| Return On Ad Spend (ROAS) | 2.1:1 | +1.3:1 | Direct result of optimization, reaching profitability |
| Conversions (Direct Sales) | 1,850 | N/A | Total direct sales attributed via multi-touch model |
| Cost Per Conversion | $97.30 | N/A | Calculated based on ad spend / direct sales |
Lessons Learned and Future Implications
The “Urban Explorer” campaign underscored the critical role of continuous content analytics and agile optimization. We learned that simply creating compelling visuals is not enough. Their effectiveness hinges on strategic placement, precise targeting, and smooth integration with the entire customer journey. The shift from a 0.8:1 ROAS to a profitable 2.1:1 was a direct result of data-driven decisions and a willingness to iterate on our visual content strategy mid-campaign. My strong opinion is that many marketers still treat visual content as a set-it-and-forget-it activity, but the data clearly shows that it requires constant scrutiny and adaptation. Ignoring the numbers means leaving money on the table, plain and simple.
For future campaigns, we will prioritize creating modular visual assets that can be easily adapted for different platforms and stages of the sales funnel. We’ll also invest more heavily in tools that offer sophisticated multi-touch attribution modeling, providing a clearer picture of how each visual touchpoint contributes to the final conversion. This approach allows for a granular understanding of visual content performance, moving beyond surface-level metrics to actionable insights.
Measuring the true impact of visual content is an ongoing process, demanding a combination of creative intuition and rigorous data analysis. By continuously refining our approach, we ensure that every visual asset contributes meaningfully to our business objectives and delivers a strong return on investment. For more on AI brand measurement, explore our latest insights.Adaptive analytics for 2026 will also be key to personal branding success.
What are the most effective metrics for measuring visual content impact beyond views?
Beyond simple views, focus on metrics like Cost Per Lead (CPL), Return On Ad Spend (ROAS), Conversion Rate (from visual content interaction to desired action), Brand Lift (via surveys measuring awareness or favorability), and Customer Lifetime Value (CLTV) for customers acquired through specific visual campaigns. These metrics tie directly to business objectives.
How can I connect visual content performance to sales data?
Integrate your content analytics platform with your Customer Relationship Management (CRM) system. Use unique tracking URLs (UTMs) for all visual content links, implement pixel tracking (e.g., Meta Pixel, Google Ads conversion tracking), and employ a multi-touch attribution model. This allows you to see which visual touchpoints influenced a lead that eventually became a customer.
What role does A/B testing play in optimizing visual content?
A/B testing is important for identifying which visual elements resonate most with your audience. Test different aspects like thumbnail images, video intros, ad copy overlays, calls-to-action, color schemes, and even the overall tone or style of your visuals. This iterative process helps refine your creative strategy based on empirical data, leading to higher engagement and conversion rates.
Should all visual content be optimized for direct conversion?
No. Visual content serves different purposes across the marketing funnel. Awareness-stage content (e.g., brand story videos) might focus on impressions, reach, and brand lift, while consideration-stage content (e.g., product demo videos) aims for engagement and lead generation. Conversion-stage content (e.g., testimonial videos) directly drives sales. Define clear objectives for each piece of visual content.
What are common pitfalls when measuring visual content impact?
Common pitfalls include focusing solely on vanity metrics like likes or shares without connecting them to business goals, using only last-click attribution which undervalues earlier visual touchpoints, failing to align visual content with landing page experiences, and not continuously testing and optimizing creative assets. Another mistake is underinvesting in the tools required for complete data analysis.


