 By Diane Hoover
Understanding audience behavior is no longer a luxury for marketers. It is a fundamental requirement for effective digital strategy. Tools like heatmaps and session recordings offer direct visual insights into how users interact with your website, revealing patterns that analytics dashboards often obscure. This direct observation can transform conversion rates and user experience. How can you effectively integrate these tools to uncover actionable insights?
Key Takeaways
- Implement click heatmaps to identify elements users interact with most frequently and those they ignore, informing layout and call-to-action placement.
- Use scroll maps to determine average scroll depth and identify content sections that capture attention versus those users bypass, guiding content prioritization.
- Analyze session recordings to observe user journeys, pinpointing areas of friction, confusion, or unexpected navigation paths that impact conversion.
- Combine heatmap and session data with A/B testing results to validate hypotheses and measure the direct impact of design or content changes on user engagement.
- Regularly review and segment heatmap and session data by device type and traffic source to uncover device-specific usability issues and channel performance variations.
1. Setting Up Your Tracking Tools
Before you can analyze user behavior, you need to properly install and configure your chosen tools. For heatmaps and session recordings, popular platforms include Hotjar, FullStory, and Microsoft Clarity. While their interfaces differ, the core setup process remains consistent: embedding a tracking script on your website.
For example, with Hotjar, you’ll create an account, add your website URL, and then copy a small JavaScript snippet. This snippet typically looks something like this:
<script> (function(h,o,t,j,a,r){ h.hj=h.hj||function(){(h.hj.q=h.hj.q||[]).push(arguments)}. H._hjSettings={hjid:1234567,hjsv:6}. A=o.getElementsByTagName('head')[0]. R=o.createElement('script');r.async=1. R.src=t+h._hjSettings.hjid+j+h._hjSettings.hjsv. A.appendChild(r); })(window,document,'https://static.hotjar.com/c/hotjar-','.js?sv=');
</script>
You then paste this code into the <head> section of every page on your site, usually right before the closing </head> tag. If you use a content management system like WordPress, there are plugins designed to simplify this process, or you can use a tag manager like Google Tag Manager. For Google Tag Manager, you’d create a new custom HTML tag, paste the script, and set it to fire on all pages.
Pro Tip: Verify Installation
Always verify your installation immediately. Most tools offer a verification step within their dashboard. Hotjar, for instance, has a “Verify installation” button that checks for the script’s presence. If it doesn’t detect it, double-check your code placement or consult your CMS documentation.
2. Creating Your First Heatmap
Once tracking is active, you can begin generating heatmaps. There are several types of heatmaps, each offering distinct insights: click maps, scroll maps, and move maps.
To create a click map in Hotjar, navigate to the “Heatmaps” section and click “New heatmap.” You’ll be prompted to enter the URL of the page you want to analyze. It’s often beneficial to start with high-traffic pages like your homepage, key landing pages, or product pages. You can choose to track a specific URL or a pattern (e.g., /products/* to track all product pages). Set the data collection period. For initial analysis, collecting data for at least 7 to 14 days provides a good sample size, especially if your site has varying traffic patterns throughout the week. For a site receiving 10,000 unique visitors per day, this period will yield substantial data.
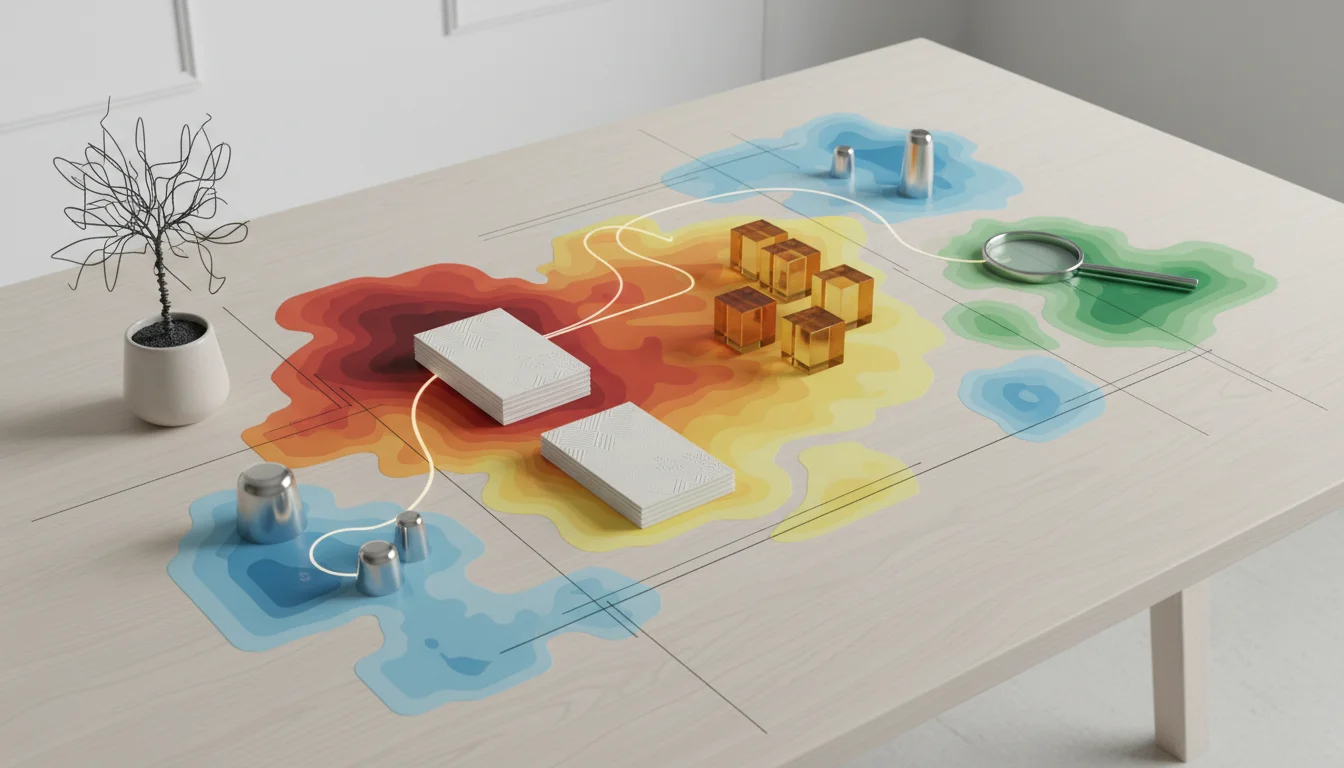
After setup, the tool will start collecting data. Once enough interactions are recorded, you’ll see a visual overlay on your chosen page, indicating where users clicked most frequently with warmer colors (red, orange) and less frequently with cooler colors (blue, green). This visual representation immediately highlights areas of interest and areas of neglect.
Common Mistake: Analyzing Too Soon
One common pitfall is to analyze heatmaps with insufficient data. A heatmap based on only 50 visits might show misleading patterns. Aim for at least 1,000 to 2,000 page views on the tracked page before drawing firm conclusions, particularly for less obvious patterns. For mission-critical pages, I often wait until 5,000 views to ensure statistical significance, especially when considering major design changes.
3. Interpreting Click and Scroll Maps
Click maps reveal where users are clicking. High click areas on non-clickable elements often indicate user frustration or a desire for more information. For instance, if a static image is heavily “clicked,” users might expect it to link to a gallery or product page. Conversely, if a critical call-to-action (CTA) button shows a weak click density, its placement, design, or copy might be ineffective.
Scroll maps illustrate how far down a page users scroll. A “fold” line typically shows the average screen height before scrolling. If your primary content or CTA consistently falls below a significant drop-off point, it suggests users are not seeing it. According to Nielsen Norman Group research, users spend 80% of their time on the content above the fold, though this varies by content type and device. If a scroll map shows that less than 50% of users reach a key section, consider repositioning that content higher up the page or making the preceding content more engaging.
Move maps (also known as hover maps) track mouse movement. While not as direct as clicks, they can indicate areas of visual attention. Users often hover their mouse over elements they are reading or considering. A cluster of mouse movements around a specific piece of text or an image suggests it’s capturing attention.
4. Using Session Recordings
While heatmaps provide aggregate data, session recordings offer a granular view of individual user journeys. These recordings capture actual mouse movements, clicks, scrolls, and form interactions, essentially showing you exactly what a user did on your site. This is where you uncover the “why” behind heatmap patterns.
When reviewing recordings, prioritize sessions that exhibit unusual behavior:
- Rage clicks: Repeated clicks on the same element, often indicating frustration or a broken feature.
- U-turns: Users working through back and forth between pages, suggesting confusion or difficulty finding information.
- Hesitation: Long pauses or erratic mouse movements before an action, possibly indicating indecision.
- Form abandonment: Watching users fill out forms and then leave, pinpointing specific fields causing issues.
Most platforms allow you to filter recordings. For example, in FullStory, you can filter sessions by users who visited a specific page, encountered an error, or spent more than a certain amount of time on a page. This segmentation helps you focus on recordings most relevant to your current analytical goals. I often filter for sessions that included a specific conversion event but also exhibited unusual behavior leading up to it.
Pro Tip: Connect Recordings to Analytics
Integrate your session recording tool with your web analytics platform, like Google Analytics 4. Many tools offer direct integrations, allowing you to jump from an anomaly detected in GA4 (e.g., a high bounce rate on a specific page) directly to relevant session recordings to understand the user experience.
5. Identifying and Addressing User Friction
The real value of heatmaps and session recordings lies in their ability to pinpoint areas of user friction. Once identified, these friction points become targets for improvement.
- Example 1: Navigation issues. A click map might show users clicking on a non-navigable image in the header, while session recordings reveal them repeatedly trying to click it before eventually using the main menu. Action: Make the image clickable and link it to a relevant page, or redesign the header to make navigation clearer.
- Example 2: Content engagement. A scroll map indicates that 70% of users don’t scroll past the first section of a long-form article. Recordings show users quickly scanning the top and then leaving. Action: Introduce a compelling summary or a strong hook at the beginning, or break the content into more digestible sections with clear subheadings.
- Example 3: Form abandonment. Recordings show users getting stuck on a particular field in a checkout form, perhaps an address validation field. Action: Add clearer instructions, provide examples, or simplify the field by using auto-fill suggestions.
After implementing changes, continue monitoring your heatmaps and recordings. This iterative process of observation, hypothesis, change, and re-observation is fundamental to continuous website improvement. It is not a one-time fix. User behavior evolves, and your site must adapt.
Understanding audience behavior through heatmaps and session recordings provides an unparalleled visual narrative of user interaction. By systematically setting up tools, interpreting visual data, and observing individual journeys, you can identify and resolve points of friction, leading to significant improvements in user experience and conversion rates. This data-driven approach moves beyond assumptions, grounding your decisions in the reality of how users engage with your digital presence.
What is the difference between a heatmap and a session recording?
A heatmap provides an aggregated visual representation of user interactions on a page, showing where users click, scroll, or move their mouse across many sessions. A session recording, however, is a video-like replay of a single user’s entire journey on your website, capturing their individual clicks, scrolls, and form inputs in real-time.
How often should I review heatmaps and session recordings?
For high-traffic pages, a weekly or bi-weekly review can be beneficial. For lower-traffic pages or after significant website changes, review monthly. The key is to collect enough data to identify statistically relevant patterns, typically after several thousand page views on the analyzed page.
Can heatmaps and session recordings help with SEO?
While not direct SEO tools, they indirectly support SEO by improving user experience (UX). Better UX, characterized by lower bounce rates, higher engagement, and longer time on page, can positively influence search engine rankings as search algorithms increasingly consider user signals when evaluating content quality and relevance.
Are there privacy concerns with using session recordings?
Yes, privacy is a significant concern. Most reputable session recording tools offer features to automatically mask sensitive data, such as credit card numbers or personal identifiable information, before recordings are stored. It is important to ensure compliance with privacy regulations like GDPR and CCPA, and to clearly inform users about data collection in your privacy policy.
What is a “rage click” and why is it important to identify?
A rage click occurs when a user repeatedly clicks on the same element in quick succession. This behavior often indicates frustration, confusion, or that an element they expect to be interactive is not working or is unresponsive. Identifying rage clicks helps pinpoint broken features, unclear calls-to-action, or areas of high user friction on your website.


