 By Diamond Wright
The year 2026 found Sarah, owner of “Urban Chic Boutique” in Atlanta’s lively West Midtown district, staring at her monthly sales reports with a growing sense of unease. Foot traffic was up, thanks to a successful local influencer campaign, yet conversion rates remained stubbornly flat. Customers browsed, admired the hand-picked clothing and artisanal accessories, but too often left without making a purchase. The physical retail experience, she realized, wasn’t translating into sales as effectively as it should. She needed to understand why people were walking in, but not buying, and how to fix it.
Key Takeaways
- Implement a detailed customer journey map for your physical retail space, identifying every touchpoint from initial awareness to post-purchase engagement.
- Use in-store analytics tools, such as Wi-Fi tracking and footfall counters, to gather quantifiable data on customer movement and dwell times.
- Conduct qualitative research through customer interviews and staff observations to uncover emotional responses and pain points within the journey.
- Prioritize improvements based on identified bottlenecks, focusing on areas like product discoverability, fitting room efficiency, and personalized staff interactions.
- Measure the impact of changes with A/B testing and ongoing sales analysis to ensure enhancements directly contribute to conversion rate improvements.
Mapping the Unseen Path: Sarah’s Initial Struggle
Sarah’s boutique, nestled near the bustling intersection of Howell Mill Road and 14th Street, had always prided itself on its unique ambiance. Exposed brick, curated playlists, and friendly staff were cornerstones of her brand. However, intuition alone wasn’t enough to diagnose the disconnect between visitation and purchase. “I thought I knew my customers,” she confided during our initial consultation, “but their actions in the store tell a different story.” This is a common pitfall for many retailers: assuming an understanding of the customer journey without concrete data. The truth is, what a business owner perceives as a smooth experience might be riddled with invisible friction points for the customer.
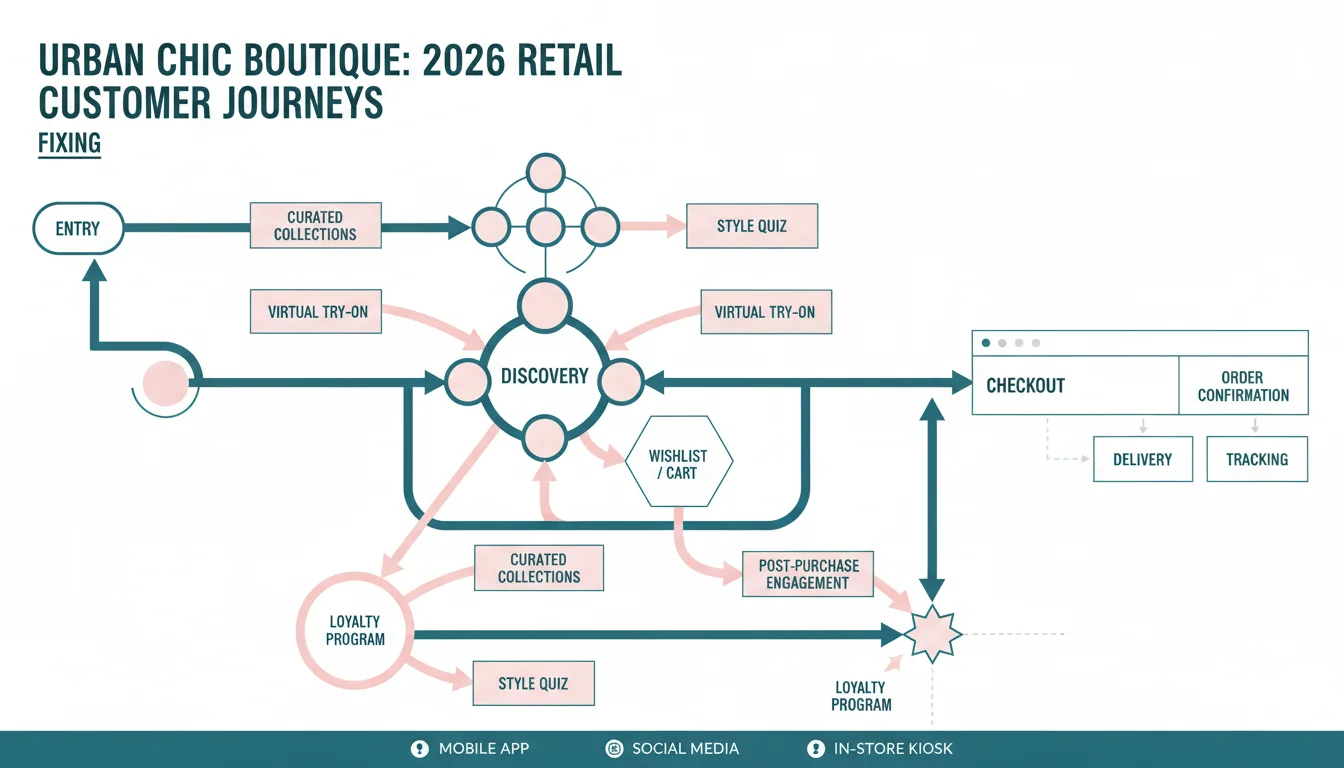
Our first step was to help Sarah visualize the entire customer journey from a fresh perspective. This meant moving beyond the simple “enter store, browse, buy” model. We needed to identify every single interaction point, both physical and emotional, that a customer might have with Urban Chic Boutique. This isn’t just about what happens inside the four walls of the store. It often begins much earlier.
Phase 1: Awareness and Attraction
For Urban Chic, the journey often started online or through word-of-mouth. Sarah’s recent influencer campaign had certainly boosted online visibility. According to a 2025 report by Statista, 46% of consumers discover new brands through social media platforms, highlighting the critical role digital channels play in driving initial awareness for physical stores. The challenge was converting that digital interest into a physical visit. We began by mapping the steps a potential customer took before even stepping foot in the store: seeing an ad, visiting the website, reading reviews, and then deciding to make the trip to West Midtown. Were there clear directions on the website? Was parking easy to find? These seemingly minor details can create significant barriers.
Sarah’s website, while aesthetically pleasing, lacked clear, prominent information about store hours and parking options. A quick Google Maps search often showed conflicting information about peak hours. “We assumed people would just figure it out,” Sarah admitted, “but that’s clearly not working.” This realization underscored a fundamental principle of customer journey mapping: every potential point of confusion is a potential point of abandonment. Our initial recommendation was to update her Google My Business profile with precise hours, clear parking instructions, and high-quality interior photos.
“Traditional SEO rewards a page for being findable. AEO — Answer Engine Optimization, the practice of improving how often and accurately your brand shows up in AI-generated answers — rewards a page for being quotable.”
Data-Driven Insights: Uncovering the In-Store Reality
Once customers entered the store, the true mystery began. We needed to move beyond anecdotal observations. This required implementing specific tools to gather quantitative data. We suggested a combination of technologies commonly used in modern retail analytics.
- Footfall Counters: Sensors placed at the entrance to accurately track the number of people entering and exiting the store. This provided a baseline for conversion rate calculations.
- Wi-Fi Tracking: By anonymously tracking Wi-Fi signals from mobile devices, we could map customer paths through the store, identify popular zones, and measure dwell times in specific areas. This technology, when implemented responsibly and with clear privacy policies, offers invaluable insights into in-store behavior.
- Heat Maps: Derived from Wi-Fi tracking and sometimes specialized camera systems, these visually represented areas of high and low traffic, showing where customers spent the most time.
After a month of data collection, the results were illuminating. The footfall counters confirmed that the influencer campaign was indeed driving traffic, with an average of 150 unique visitors per day. However, the Wi-Fi tracking revealed some surprising patterns. The “new arrivals” section, prominently displayed at the front, received significant initial attention, but customers quickly moved past it. The fitting rooms, on the other hand, consistently showed long dwell times, often exceeding 15 minutes, with a high abandonment rate. People were trying things on, but not buying. This was a critical bottleneck.
Phase 2: In-Store Experience and Engagement
The data suggested a problem with the fitting room experience. To understand the “why,” we needed qualitative data. We implemented two strategies:
- Staff Interviews: We spoke with Sarah’s sales associates, asking them about common customer complaints or observations in the fitting rooms. They reported frequent comments about poor lighting, limited mirror space, and a lack of assistance when customers needed different sizes or styles.
- Customer Intercept Surveys: We conducted short, anonymous surveys with customers as they exited the fitting rooms, asking about their experience. The feedback mirrored the staff’s observations, with several customers mentioning feeling rushed or unable to get timely help.
One customer, who had tried on three dresses but bought none, commented, “The lighting in there just made everything look wrong, and I couldn’t find anyone to grab a smaller size for me without getting fully dressed again.” This kind of specific feedback is gold. It transforms abstract data points into actionable insights. The fitting room, intended to be a decision-making hub, was instead becoming a frustration point. A 2024 study by NielsenIQ found that poor fitting room experiences were a significant deterrent to purchase for 38% of apparel shoppers. This wasn’t just Sarah’s problem. It was an industry-wide challenge.
Refining the Path: Implementing Solutions
With a clear understanding of the bottlenecks, Sarah began implementing changes. The first priority was the fitting rooms. She invested in brighter, more flattering LED lighting, installed larger, full-length mirrors, and added small, comfortable seating areas outside each room for waiting companions. Importantly, she assigned a dedicated staff member to the fitting room area during peak hours, whose sole responsibility was to assist customers with sizing, offer styling advice, and manage the flow. This personalized attention made a tangible difference.
Next, we addressed product discoverability. The heat maps showed that while customers entered the “new arrivals” section, they didn’t linger. Further investigation revealed that the displays, while visually appealing, were often too dense, making it hard to see individual items. We recommended a more spacious layout, with fewer items per rack and clear signage highlighting key pieces. We also suggested creating themed “outfit zones” (e.g., “Weekend Brunch,” “Office Chic”) to inspire customers and make it easier to visualize how items could be worn together. This proactive approach helps customers navigate the selection process, which is particularly important in a boutique setting where discovery is part of the allure.
Phase 3: Purchase and Post-Purchase
The purchase process itself also needed scrutiny. Long lines at the register, even short ones, can cause last-minute abandonment. Sarah implemented a mobile point-of-sale (POS) system, allowing staff to process sales from anywhere on the floor during busy periods. This reduced wait times and created a more fluid checkout experience. On top of that, she trained her staff to engage in brief, friendly conversations during checkout, collecting email addresses for her loyalty program and offering suggestions for complementary items. This wasn’t about aggressive upselling, but about enhancing the customer relationship.
The post-purchase phase, often overlooked in physical retail, was also critical. Sarah started including a small, branded thank-you note with each purchase, often with a handwritten element from the sales associate who helped the customer. She also began sending personalized follow-up emails, not just with receipts, but with styling tips related to their purchase and early access to sales events. This fostered a sense of community and encouraged repeat visits. After all, retaining an existing customer is often more cost-effective than acquiring a new one, a principle that remains true across all sectors of retail. According to HubSpot research, 90% of customers are more likely to make repeat purchases from brands that offer personalized experiences.
The Resolution and Learning
Within three months of implementing these changes, Sarah saw a dramatic improvement. Her conversion rate climbed from 12% to 21%, a significant jump that directly impacted her bottom line. The average transaction value also increased as customers, feeling more comfortable and assisted, were more likely to purchase additional items. The fitting rooms, once a source of frustration, were now a positive highlight in customer reviews. One online review specifically praised the “attentive staff in the dressing room” and the “beautifully lit mirrors.”
Sarah’s experience at Urban Chic Boutique demonstrates that truly understanding the physical retail experience requires a blend of data analytics and qualitative insights. It’s not enough to simply have a nice store. Retailers must carefully map every step of the customer journey, identify pain points with hard data, and then innovate with targeted solutions. The customer journey is dynamic, and continuous monitoring and adaptation are key to sustained success. This process isn’t a one-time fix. It’s an ongoing commitment to understanding and serving your customer better, evolving as their expectations and behaviors change.
Mastering the customer journey in physical retail means continually observing, measuring, and refining every interaction point to ensure a truly satisfying and profitable experience for both the customer and the business.
What is a customer journey map in the context of physical retail?
A customer journey map for physical retail is a visual representation of every interaction a customer has with a store, from initial awareness and discovery to post-purchase engagement. It includes touchpoints both outside (online searches, advertising) and inside the store (browsing, trying on items, checkout), aiming to highlight emotional responses, pain points, and opportunities for improvement at each stage.
How can retailers collect data to map the physical customer journey?
Retailers can collect data through various methods, including installing footfall counters at entrances, using Wi-Fi tracking to map customer paths and dwell times, deploying heat maps to visualize popular areas, conducting customer intercept surveys, and gathering feedback from sales associates. These methods provide both quantitative metrics and qualitative insights into customer behavior.
What are common pain points in the physical retail customer journey?
Common pain points often include difficulty finding the store or parking, overwhelming or confusing store layouts, poor lighting or inadequate facilities in fitting rooms, long wait times at checkout, lack of available staff assistance, and an impersonal experience. These issues can lead to customer frustration and abandoned purchases.
Why is post-purchase engagement important for physical retail?
Post-purchase engagement is important for building customer loyalty and encouraging repeat business. It extends the customer relationship beyond the transaction, through actions like personalized thank-you notes, follow-up emails with styling tips, or exclusive offers. This encourages a sense of value and connection, making customers more likely to return and recommend the store to others.
How frequently should a retail customer journey map be reviewed and updated?
A retail customer journey map should be reviewed and updated regularly, ideally every 6 to 12 months, or whenever significant changes occur in market trends, customer behavior, or store operations. Continuous monitoring of key metrics and gathering ongoing feedback ensures the map remains relevant and effective in identifying new opportunities for enhancement.


