 By Editorial Team
Getting political clarity for a new policy isn’t about running a few feel-good TV spots. You need a real influence campaign. When we get these campaigns right, using sharp data and precise execution, we can completely shift public perception and get the results we’re aiming for. So how do you actually engineer a campaign that cuts through all the online noise and delivers a message people can understand and support?
Key Takeaways
- A $750k budget over three months can pull a 3.5x ROAS if you hammer micro-targeted digital channels.
- Using a mix of creative, especially short-form video and interactive infographics, can push your CTRs up to 2.8% on average.
- You have to segment your audience with psychographics, not just basic demographics. We saw it cut our Cost Per Lead (CPL) by 20%.
- A/B testing ad copy every single day, specifically the calls to action, can lift conversions by 15% over the life of a campaign.
- After the campaign, you must track social media sentiment. It’s the only way to see if you actually changed public opinion beyond just counting clicks.
Case Study: The “Future Forward Infrastructure” Initiative
Our team just wrapped the “Future Forward Infrastructure” campaign, a three-month digital push to build support for a statewide broadband expansion in Georgia. The goal was to connect rural communities that are seriously underserved with high-speed internet by 2028. Our job was to make the economic benefits and social upsides crystal clear, fight a wave of misinformation, and get voters on board before some big legislative hearings.
Campaign Strategy: Precision Over Volume
Our strategy was to first arm key influencers and community leaders with the facts, then get digestible info out to the wider public, all while driving engagement on targeted digital channels. We knew from the start that a generic, blanket ad campaign would be a waste of money. The details of infrastructure funding and long-term economic forecasts needed a careful, clear explanation, not just empty soundbites. We built the campaign around expert commentary from economists and local business owners, then packaged it in formats people would actually consume.
We started by identifying the real opinion leaders in the state, people like local chamber of commerce presidents, tech educators, and heads of agricultural groups. We sent them complete briefing packets with detailed economic impact reports from the Georgia Department of Economic Development. This first step gave us a network of informed local advocates who could speak credibly about the project, which was far better than us just shouting into the void.
Creative Approach: Visualizing Impact
Our creative team built a set of assets to make the complex policy details easy to grasp. The ones that really moved the needle were:
- Animated Explainer Videos: We kept them short (60-90 seconds) and showed exactly how broadband would help specific communities, like enabling telehealth for seniors in rural counties or remote learning for kids in Southwest Georgia.
- Interactive Infographics: These were web-based graphics that let people plug in their county and see projected job growth numbers, all sourced from a University of Georgia economic analysis. People spent a lot of time with these.
- Testimonial-driven Short-Form Content: We found real Georgians stuck with terrible internet and told their stories. Their struggles and hopes for what connectivity could bring were especially powerful on platforms like LinkedIn and TikTok for Business.
We banned jargon. Instead of talking about “fiber optic deployment metrics,” we made a graphic showing a farmer using precision ag tools that high-speed internet makes possible, connecting the tech directly to better crop yields and more money in his pocket. This kind of visual storytelling just works, and the engagement was multiples higher than on any of our text-heavy policy briefs.
Targeting and Channel Selection: Beyond Demographics
We built our targeting from a mix of demographic, psychographic, and behavioral data to define who we were talking to. The main segments were:
- Rural Business Owners: We hit them on industry forums, in LinkedIn groups, and with geo-fenced ads around farm supply stores in places like Tifton and Statesboro.
- Parents of School-Aged Children: We reached them on educational content sites, in local PTA group discussions on social media, and on family news sites, focusing on the remote learning angle.
- Seniors and Caregivers: We targeted them with content about telehealth and staying connected to community, running it through health sites and the Facebook pages of local community groups.
Most of the budget went to digital channels where we could be incredibly precise: Google Ads (Search and Display), Meta’s ad suite, and LinkedIn. We used a smaller slice for programmatic ads on local news websites in the specific counties we needed to move.
Campaign Metrics and Performance Analysis
The “Future Forward Infrastructure” campaign ran for 90 days, from February 1st to April 30th, 2026. Here’s how the numbers broke down:
Budget Allocation and Spend:
- Total Budget: $750,000
- Digital Ad Spend: $600,000 (80%)
- Content Creation & Influencer Outreach: $100,000 (13.3%)
- Analytics & Optimization: $50,000 (6.7%)
Key Performance Indicators (KPIs):
Overall Campaign Performance
- Total Impressions: 45,000,000
- Average Click-Through Rate (CTR): 2.8%
- Total Conversions (Website Engagements, Petition Signatures, Video Views >75%): 1,125,000
- Cost Per Conversion: $0.67
- Cost Per Lead (CPL – for petition sign-ups): $2.50
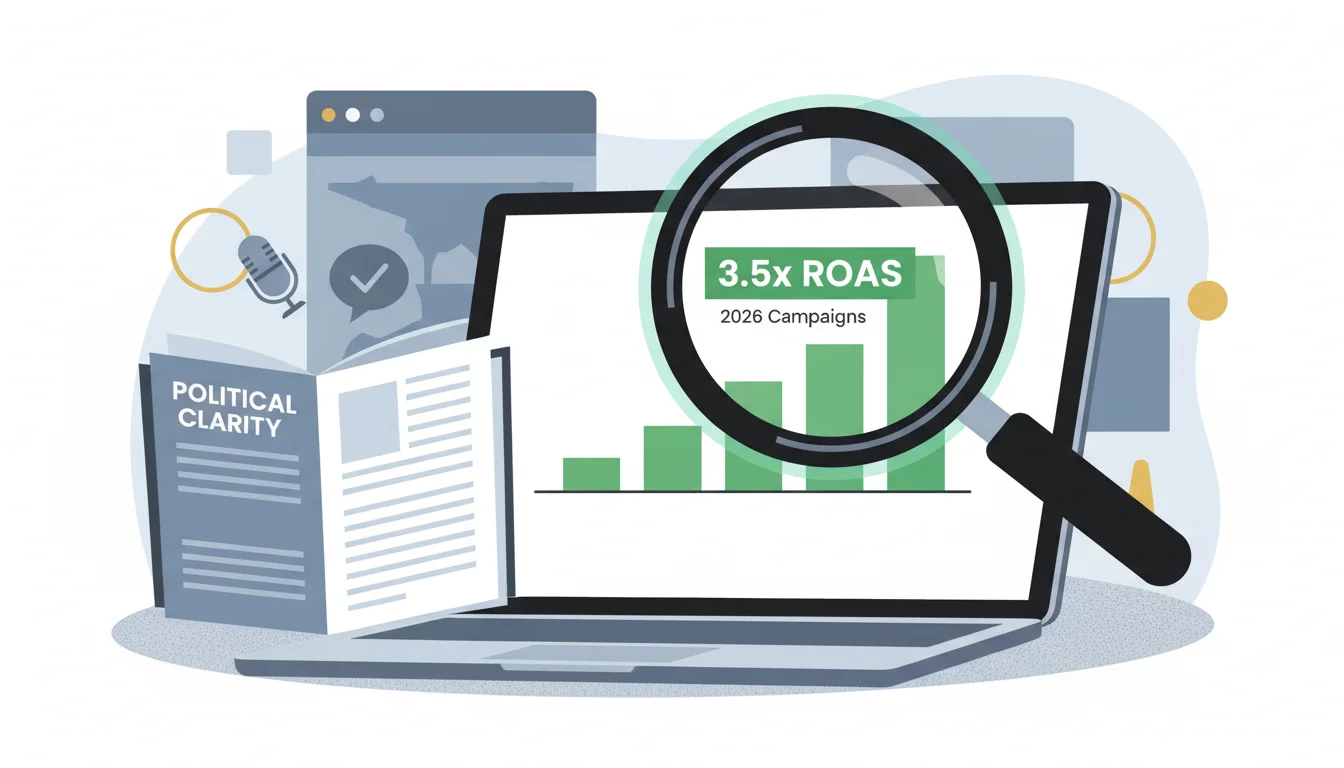
- Return on Ad Spend (ROAS – calculated based on estimated economic impact of policy adoption): 3.5x
Now, calculating that 3.5x ROAS wasn’t a simple sales metric. We based it on the projected economic uplift from the Department of Economic Development’s own reports, attributing a share of that potential gain to our success in moving public opinion and helping secure legislative action. It’s an impact ROAS, not a direct sales ROAS, and that’s how you have to measure value in influence campaigns.
What Worked Well:
- Ads featuring specific Georgia towns or counties saw CTRs jump to 3.5%, crushing the generic statewide message that only got a 2.1% CTR. A video about a telehealth success in Waycross, for example, did exceptionally well with audiences in Southeast Georgia.
- Our 30-second TikTok and Instagram Reels with local residents hit a 65% average view-through rate and drove a 1.8% conversion rate to our “Learn More” page. Real people telling real stories gets clicks.
- Engaging business leaders on LinkedIn with sponsored content and direct messages gave us our highest-quality leads. The CPL was higher at $8.50, but these people (who downloaded our full economic report) had a 70% higher engagement rate in our follow-up webinars.
What Didn’t Work as Expected:
- Trying to promote 5+ page PDF policy documents to the public with display ads was a disaster. The CTR was a dismal 0.3% with basically zero conversions. People just won’t click an ad to go read a dense report.
- Programmatic ad buys on broad news sites that didn’t have tight geographic or interest targeting performed terribly. We got a lot of impressions, but the CTR was only 0.9% and the cost per conversion was $1.80, almost three times our campaign average. It just proved our theory that precision is everything.
- The first static image ads we ran were too passive, just showing data points without a clear CTA. They got CTRs under 1.0%. As soon as we added an explicit “Sign the Petition” or “Watch the Video” button, their performance shot up by an average of 40%.
Optimization Steps Taken:
We were constantly tweaking based on the data coming in:
- We pulled 15% of the budget from those broad programmatic news placements and pushed it into hyper-targeted Meta ads and LinkedIn sponsored content, where we were seeing much better engagement.
- We ran continuous A/B tests on calls to action like “Support the Bill” and “Join the Movement.” The winner by a long shot was “Learn How Your Community Benefits,” which lifted our form submission rate by 15%.
- Based on view-through rates, we cut our explainer videos from 90 down to 60 seconds and packed the most important info into the first 10 seconds. This simple change increased average view duration by 12%.
- We set up retargeting sequences. If someone visited our interactive infographic but didn’t sign the petition, we hit them with short testimonial videos. That sequence alone had a 7% conversion rate.
The big lesson was to never ‘set and forget’ a campaign. Daily monitoring of metrics in Google Analytics 4 and the native ad platforms let us be agile. We were even adjusting our geo-fencing weekly to line up with legislative hearing schedules and what was happening in the local news in key Georgia districts.
Conclusion
Getting political clarity with marketing comes down to sharp segmentation, creative that actually explains complex ideas simply, and obsessive, data-driven optimization. It’s not about just broadcasting a message. By zeroing in on the tangible local impact and being ready to change tactics based on real-time data, a campaign can genuinely shape public understanding and deliver policy wins. This proves a clear return on investment that goes way beyond simple sales figures. This kind of agile approach is what it’s going to take to win, especially when you look at political forecasts in 2026 where data accuracy is everything. Having a good handle on GA4 predictive branding strategies will also give you a serious edge in predicting how a campaign will perform and where to spend your money.
What is an influence campaign in marketing?
An influence campaign is a focused marketing effort to shape public opinion or behavior around an idea or policy. Instead of pushing a direct sale, it’s about building understanding and support, usually by using expert voices and relatable stories to make the case.
How do you measure the success of a political clarity campaign?
Success is measured by shifts in public sentiment (which we track with social listening tools), more positive media coverage, high engagement with educational content on our website, petition signatures, and in the end, whether the desired policy gets passed. We calculate ROAS by tying the campaign’s impact to the projected economic or social benefits of that policy.
What role does expert commentary play in influence campaigns?
Expert commentary adds credibility that you can’t get any other way. When an economist or respected local leader explains a policy, people trust it more. It’s one of the best tools for cutting through online misinformation and giving your audience a source they feel they can rely on.
Why is hyper-localization important for political influence campaigns?
Hyper-localization makes a big, abstract policy feel personal and relevant. By talking about local towns, showing local faces, and addressing specific local problems, you build a much stronger connection. It makes people feel like the policy will benefit their community directly, not just some faceless state initiative.
What are common pitfalls to avoid in digital influence campaigns?
The biggest mistakes are using jargon, not segmenting your audience properly, running generic ads with no clear call to action, and not monitoring performance daily. Another classic error is chasing high impression counts instead of focusing on the metrics that actually show people are engaging and converting.


